Built a multi-page financial planning dashboard in Streamlit + PostgreSQL to model a 40-year household projection, inspired by FIRE (Financial Independence, Retire Early). Upgraded from a scenario-based Excel financial model to a fully interactive, database-driven application with significantly expanded scenario and sensitivity analysis capabilities.
Key technical work:
- Stood up a 40-year per-account projection engine modeling investment accounts (taxable, tax-deferred, Roth, real estate), variable income schedules, and year-by-year surplus/deficit cash flows routed through a designated buffer account
- Designed a PostgreSQL schema (7 tables) for named scenarios with full assumption, balance, income, expense, and mortgage data. All editable in-app with changes persisted back to the DB, a significant upgrade from the Excel model
- Built a Sensitivity Analysis page with color-coded HTML tables (nominal and inflation-adjusted) showing investable assets at Year 10 across a growth rate × annual expense matrix; each cell calls the projection engine directly to guarantee exact match with the Overview page
- Built a Compare Scenarios page with side-by-side KPI cards with deltas, dual line charts (nominal + inflation-adjusted), and a 10-year side-by-side detail table including inflation-adjusted investable asset columns
- Added an Expenses page with editable budget categories and a Mortgage page backed by a cumulative amortization schedule in Postgres, both with save-to-DB functionality
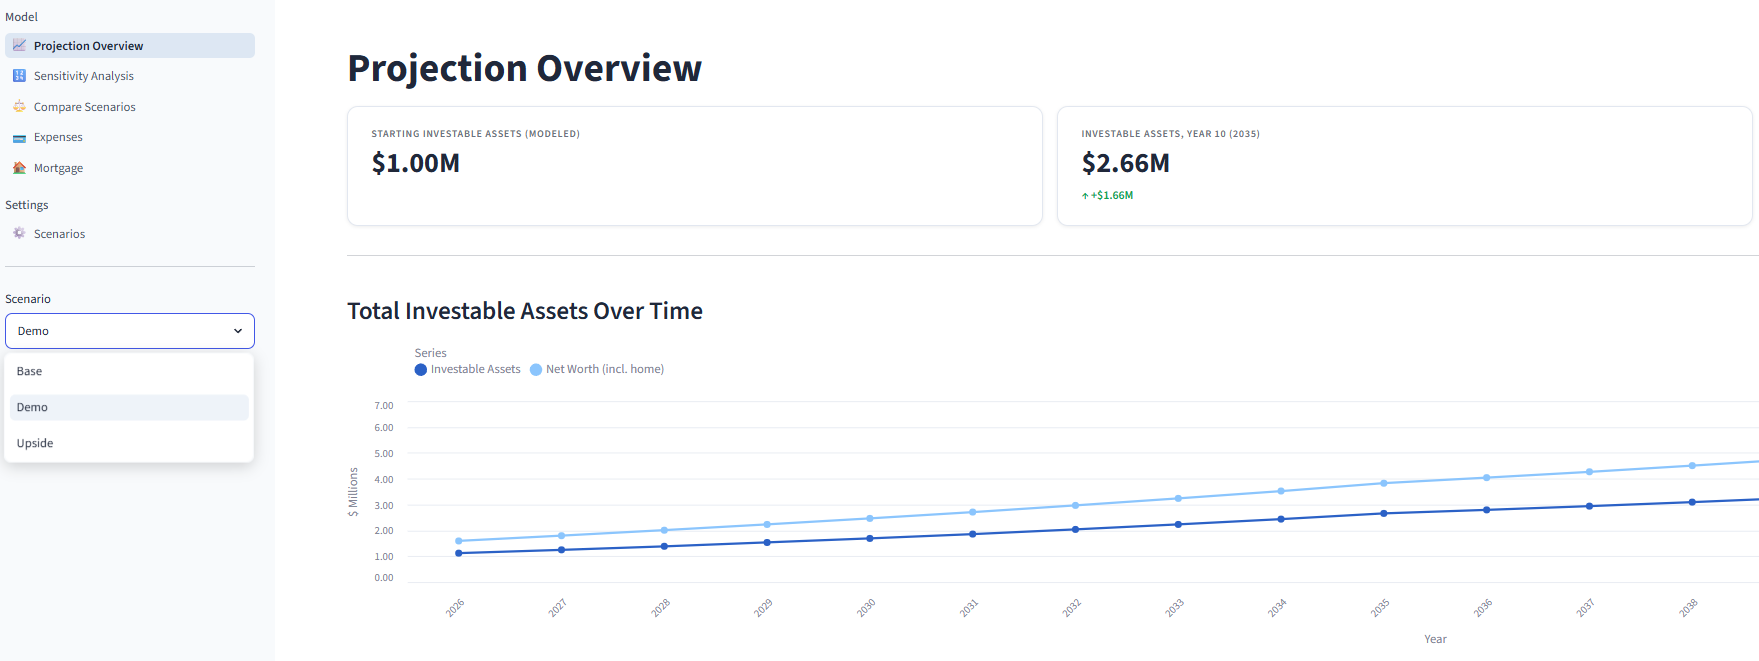
- Implemented Altair/Vega-Lite charts throughout: assets over time, account breakdown, income vs. expenses, scenario comparison lines, and mortgage amortization
- Full dashboard: 6 pages, projection model, sensitivity engine, and schema. Built iteratively with Claude Code from the Excel model foundation and completed in ~3 hours