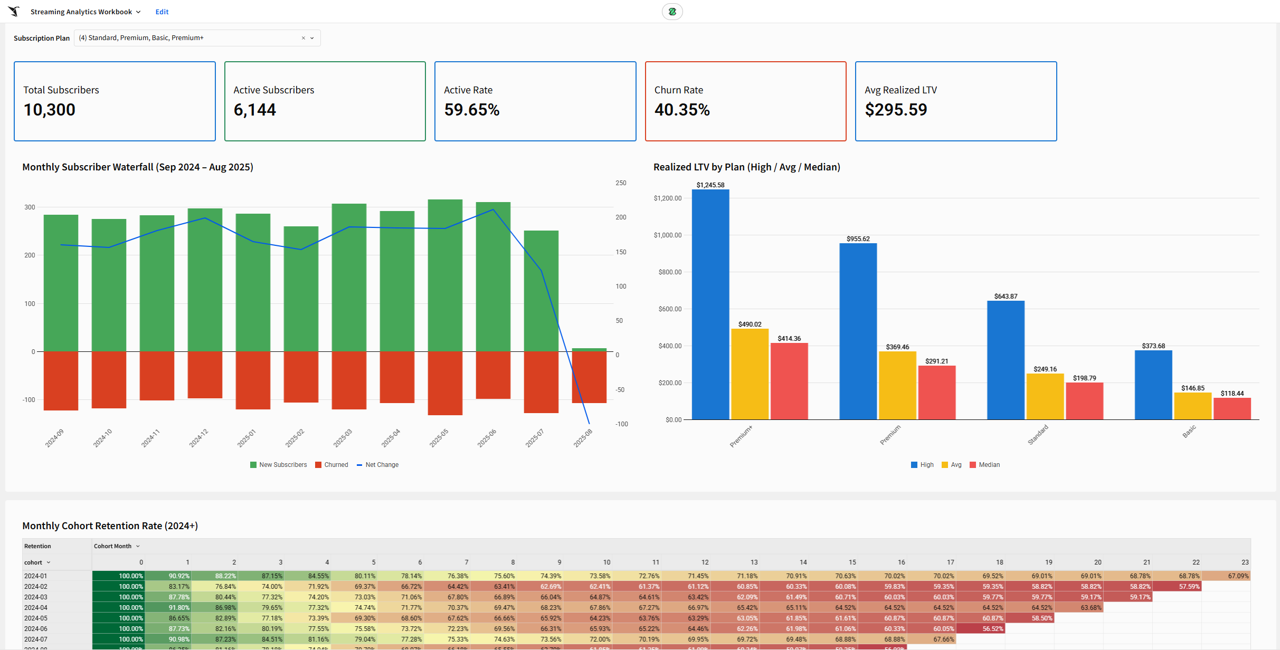
Ported a Claude Code-developed, synthetic Netflix streaming analytics HTML dashboard (4 tabs, ~10K subscribers, 105K watch sessions) to a production Sigma workbook, rebuilding the Python data pipeline from scratch in order to generate Sigma-compatible CSVs that were added to and power a Sigma data model.
Key technical work:
- Rewrote
sigma_export.py, expanding output from four CSVs to nine; addedwaterfall.csv,top_titles.csv,top_titles_by_plan.csv,device_summary.csv, andmonthly_views.csvas pre-aggregated files for charts that could not be derived cleanly in Sigma from grain-level session data - Applied all notebook transformations at row level: device watch/completion multipliers, seasonality on watch duration, plan duration/completion multipliers; device session count overrides and monthly seasonality on counts/rates handled in pre-aggregated files
- Added
subscription_plandimension tocohort_retention.csvandwaterfall.csvso that the plan filter control on the LTV tab correctly targets all three data sources - Completed in Sigma: LTV tab (all 4 charts + KPIs with working plan filter) and Content tab (all 5 KPIs + 4 charts across 4 data sources)