Data Informed Experiments
I am presently VP of Product (Revenue and Analytics) at FloSports, a direct-to-consumer provider of live streaming and on-demand digital sports content. In this role, I focus on product innovations which can drive top-line growth while also overseeing analytics (business, product, and data, among others). Recently, our CEO Martin Floreani has spoken about the business intelligence platform we have been building out since last year, which is internally known as Neptune. His interview with Sports Techie, where he discusses the impact Neptune has had on the business, can be found here. I have been fortunate to be one of FloSports’ founding members of Neptune and am responsible for overseeing both our data source and business intelligence reporting roadmaps.
My goal in this post is primarily to:
- Jump start contributing my learnings in this role, where so many others before me have given back and from whom I’ve learned a great amount
- Assist with continuing the momentum of companies becoming “data informed” rather than “data driven”
- Relay a hypothetical experiment and its related process which is similar to the framework and approach that we leverage at FloSports
First, what is the difference in being “data informed” versus “data driven”. There are several solid online resources which discuss this; for the sake of time I will quickly highlight an insightful one which I read very recently. In this Interana post, the author delineates between the two as the following:
- Data-driven: You let the data guide your decision-making process
- Data-informed: You let data act as a check on your intuition
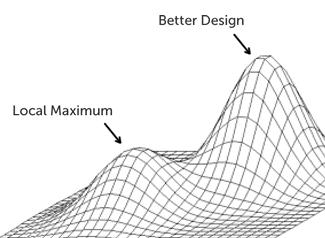
Essentially, when an organization says that it is “data driven”, one risk it could be introducing is the possibility of optimizing for local maximums; this can occur due to solely focusing on the quantitative aspects of the available data, potentially disregarding key, relevant elements of the company’s underlying business model, and this approach can even run the risk of ultimately leading to a poorly driven decision due to inherent data biases related to the data’s collection and analysis.
It is this last aspect that I would like to focus on. Companies are constantly evaluating ways to expand the number of subscribers who make it through their activation funnel; one potential hypothesis to consider is whether or not a free trial offering would be beneficial to the business. Free trials are used by numerous online streaming companies, such as Netflix, Hulu, and WWE.
When testing a free trial, everyone understands that we are evaluating if activations spike with the “try before you buy approach” relative to the traditional request for an upfront payment. Some of the key metrics that I believe would be important to monitor in order to determine this particular experiment’s success, which also must be adjusted / normalized, include:
- Upfront conversion rate: the % of visitors who start a subscription
- Plan % mix: the % of all started subscriptions who select a certain plan option, which may fluctuate by experiment variant
- Trial-to-pay conversion rate: while the trial may generate greater upfront conversions, one must convert the trial subs to pay after the trial period
- M1 Retention: compare historical retention curves to free trial participant retention; we need to be cognizant of how the free trial also impacts the lifetime value of subscribers (in addition to the upfront metrics cited above)
The final piece to this analysis could be which subscribers should be included in evaluating the overall results. Many digital streaming providers have subscribers who churn and then return at a later date; the industry term for these is “reactivations”. For this particular experiment, I would most likely focus on “new” subscribers. We want to expand the overall activations within our funnel. Reactivated subscribers are more familiar with the product offering, as former subscribers, and also have different objectives and most likely different retention curves than new subscribers.
How could being solely “data driven” lead to the wrong conclusions for a business analyzing the results of this experiment?
There are several ways in which I believe one could poorly design this experiment and the framework used to evaluate the results. First, all site visitors could be treated equally, which I would argue is introducing flaws into the experiment’s data. As previously mentioned, I would only extract the subscribers in the experiment who are “new” — this better reflects the impact that “try before you buy” has on a subscriber’s willingness to activate. Including reactivated subscribers in the equation, who are more familiar and could even be potentially looking to game the system, could also skew the data, e.g., really high conversion rates (but they’re familiar with the product and liked not having to pay their first x days back).
Also, if you focus solely on upfront conversions, you might believe that you have something incredible on the line; however, the product needs to stand on its own and convince subscribers to pay post trial period. If the experiment yielded 2x the upfront conversions, but the company only converted 50% of those conversions post trial, you are not better off and could potentially be worse off overall.
There are qualitative aspects to the free trial and fundamental business model realities which also need to be understood. As one example, from a customer service perspective, are we introducing confusion and frustration, or are we increasing overall subscriber satisfaction and appreciation? While the quantitative results show the impact on metrics, there are other areas of the business that could enhance or diminish the overall results of the experiment and the anticipated long-term impact for the business.
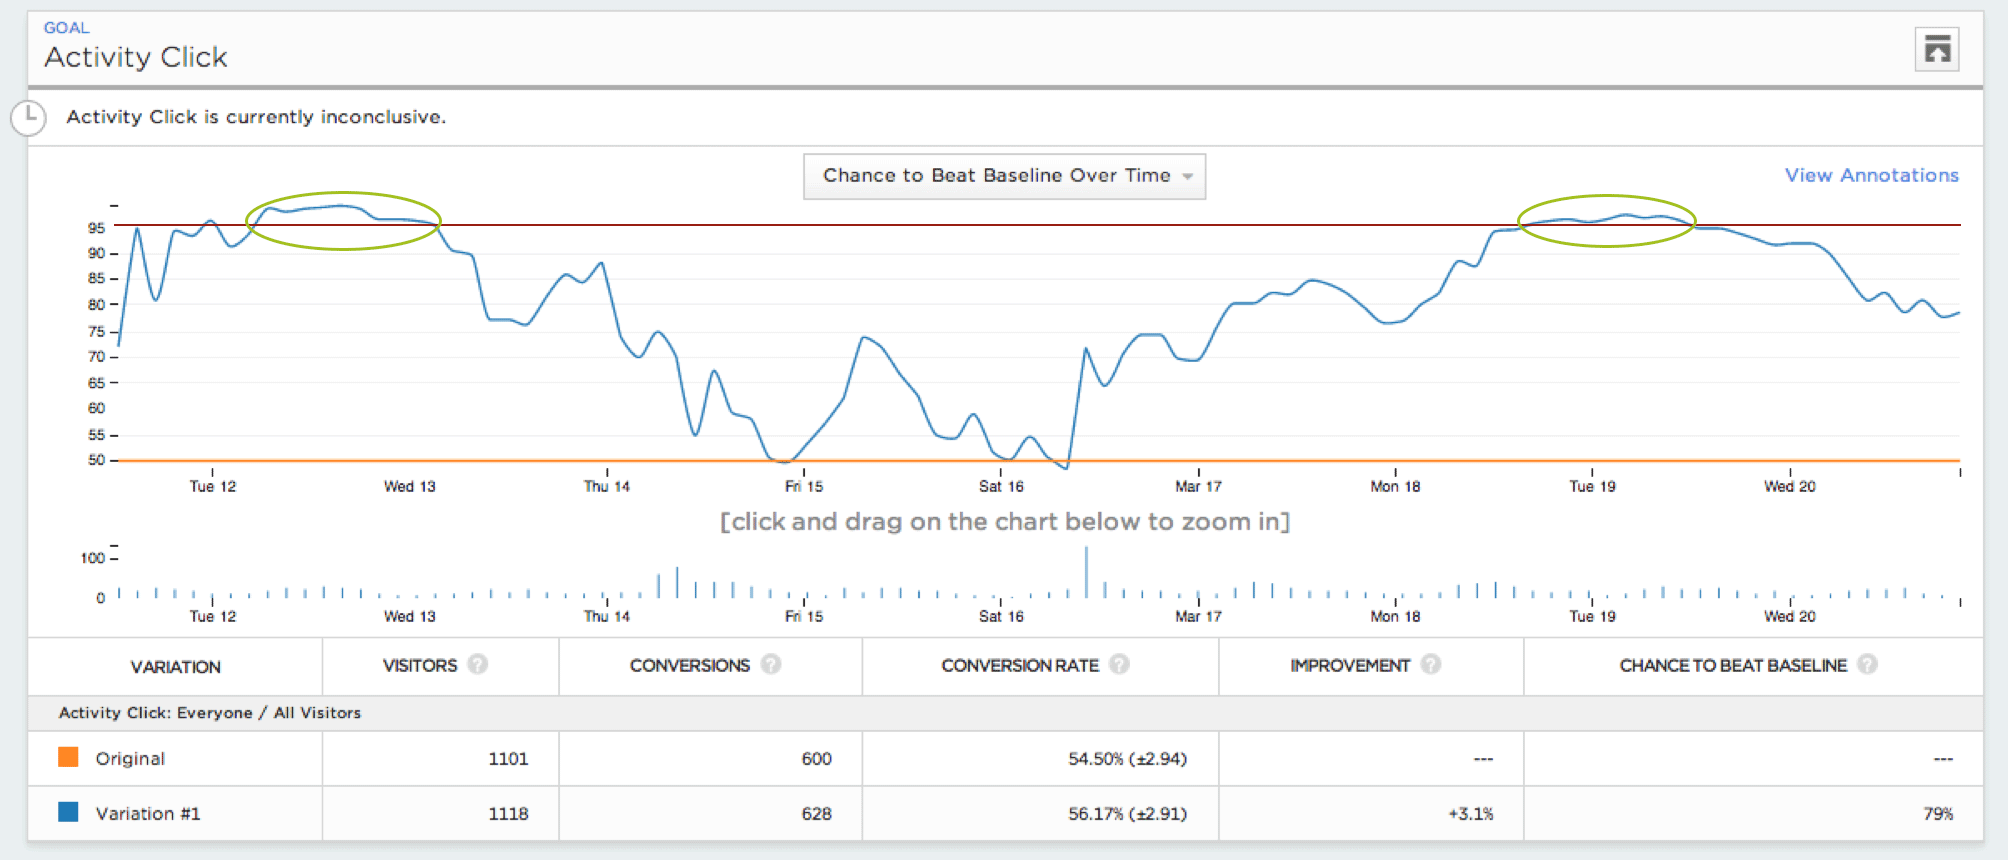
Last, and potentially most critically, let’s say that we let the experiment run for 3 months. If we did better overall during that period, does that mean that we should provide a free trial across the board? Not necessarily. We would want to evaluate observations at various times during the experiment’s duration to see if there were fluctuations in the results and, if present, understand the underlying reason(s) for those fluctuations. “Nature may abhor a vacuum” but experiment results will be volatile, unpredictable, potentially noisy and interpretation will most likely be parts art and science.
In summary, being data informed is incredibly powerful. The experiments that we run always have the potential to surprise us one way or another. Having a framework by which we collect, analyze and normalize data, as well as how we use this data to check our intuition, can definitely have a strong impact on driving growth. Our company culture has evolved to make sure that all opinions have data to support or refute that view, and we are constantly hypothesizing how we can advance our business and also collect additional data. Businesses are constantly evolving, seeking a competitive advantage, and the most critical questions to answer are the ones you are not even yet aware you should be asking.
In future posts, I would like to continue to share my perspective on how to help evolve a “data informed” company culture, continue to dive into hypothetical experiment and analytical scenarios, and discuss in more detail the applications which sit within our data and analytics stack. If you found this post useful or have examples you would like to share, I would love to hear from you in the comments.
Additional image citations:
- The risk of optimizing for local maximums; from Andrew Chen: “Know the difference between data-informed and versus data- driven”
- Photo Credit: Optimizely from Optimizely’s blog. Stat Engine is a powerful tool which shows near real-time results and statistical significance of those results.
- Featured picture from Wikimedia Commons. This image illustrates the maxim that “nature abhors a vacuum.” This is not necessarily the case with the consistency of experiment results across time.