Data Informed Rolling Forecasts
As VP of Product at FloSports, I oversee our data warehouse roadmap and manage a team consisting of a senior product manager, product revenue developers, data engineers, and data analysts. Some of the responsibilities that I really enjoy about this work include working at the forefront of business intelligence, leveraging data and product analytics tools such as Periscope Data, Mode Analytics and Segment, and collaborating with very bright people to drive measurable results and accelerate our growth.
An additional aspect of my job is that it also straddles the line between senior management / business initiatives and data science / optimization efforts. This can involve running an A/B experiment or analyzing behavioral analytics data that we then feed into a scenario-based financial model, aka “data informed financial analysis”. Additionally, we are a Series B stage sports technology company which has grown substantially in the past year and now has ~25 different sports that we are tracking.
As part of all of our key efforts, one new initiative that I spearheaded prior to the start of our Q2 this year (we are on a calendar year) is what I call a “Data Informed Rolling Forecast”. In this post, I’ll walk through at a macro level how this was accomplished and how Periscope Data was invaluable in helping us achieve a pacing dashboard -- with limited to no engineering time required.
Below is the list of ingredients that were necessary for me to accomplish this (most of this type work is a marathon, not a sprint):
- An understanding of the key drivers of your business and economic model
- A query-able database (our reporting warehouse resides on Redshift) to conduct historical benchmarking
- Business intelligence tools which facilitate database querying and extraction
- A bottoms-up financial model template, ideally scenario and case based (e.g., only growth from existing business versus existing + high probability to close business, bull / base / bear cases, etc.), which builds off of most recent actuals from #2 and forecasts expected results for the next quarter
- Business intelligence tools which facilitate the creation of a pacing dashboard
- A process to conduct post-mortem analysis regarding strengths / areas for improvement within the overall framework (Future post)
Part 1: Understanding key drivers and benchmarking
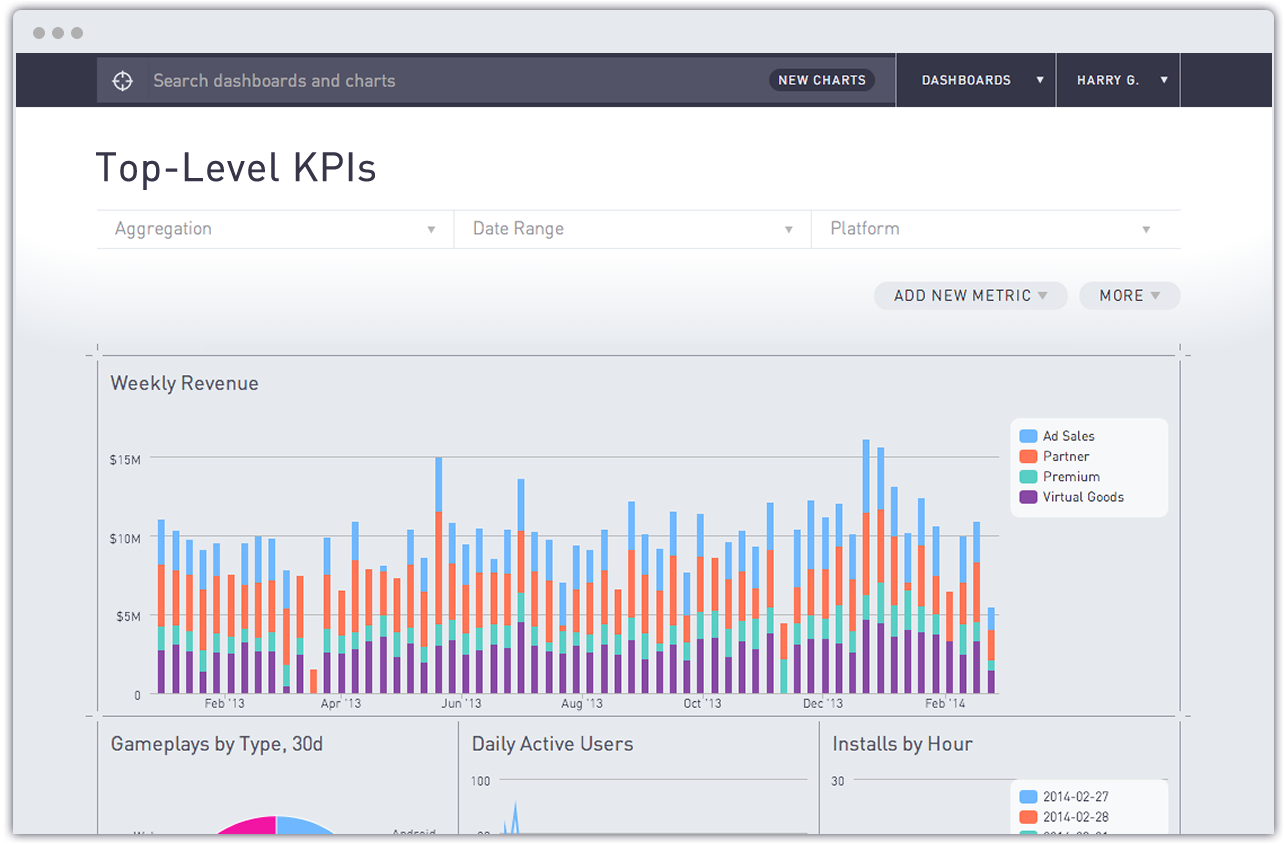
When I first arrived at FloSports, one of my first action items was to understand our existing KPIs; this included everything from understanding what was being tracked, why it was being tracked, and how it was being tracked. As I’ve also written about previously, when I arrived we did not yet have a data warehouse. The initial data source that we ETL’d into the warehouse that we stood up was our Stripe payments data. To kick this off, we sat down with a data science consultant who was familiar with our business given his involvement with our preparation for our next round of funding. As part of that process, and without going into too much detail, we mapped out all of our existing plan offerings, the movement across plans and sports that our subscribers exhibited, and how we wanted to define our subscriber types and plan intervals. As an example, we could map out our different subscriber types based on the type of payment made combined with where the subscriber was in his / her lifecycle with a particular sport offering. To show illustrative examples of subscriber types for clarity:
- New: subscriber makes a payment for the first time for a particular sport’s subscription
- Reactivation: subscriber, who has been a subscriber prior to previously canceling, returns and makes a payment for a particular sport’s subscription
- Recurring: subscriber makes a recurring payment for his / her particular sport’s subscription
Aggregate Fact Tables. Given the range of our sports and plan offerings, queries can become rather complicated, especially for sports with multi-year histories and lots of activity from both new and existing subscribers. Given this, our most common reporting use cases, once fleshed out and well understood, are generally converted into aggregate fact tables which will often combine two, three or more different data sources. We have built aggregate fact tables for key performance metrics including subscriber waterfalls (monthly grain) and payments (daily grain). Leveraging these data rich fact tables and a flexible BI tool like Periscope Data, we were able to create a historical benchmarking dashboard, filterable by sport, which we can bend as needed via SQL and then download as a CSV and load into our financial models.
Part 2: Building the bottoms-up financial model template
Given the reality that we have 25+ sports and time is finite, one of my primary goals in building the bottoms-up financial model for each sport was to make the model dynamic and flexible; this facilitated limited, if any, rewiring of the model for each case, as we are able to flex the model based on different launch dates and the historical performances for each sport.
As an example, some sports have been around for several years, whereas others only have a few months of historical data. Rather than building each model to conform to each individual sport’s history, and also needing to rebuild each model every quarter, I spent a lot of upfront time figuring out how to best flex the model. Examples of what we’re able to dynamically feed through all 15+ worksheets includes:
- Subscriber cohort retention waterfalls
- Weighted average retention curves across all historical cohorts with projected future churn based on decay rates
- Historical plan selection mix, e.g., % monthly / yearly
- Subscriber corkscrew build over time -- beginning plus new less churned equals ending (monthly grain); (also helpful for MRR by plan offering and sport)
- Weekly forecast for the quarter based on historical cohorts and their projected recurring payments and combined with forecasted new and reactivated subscriber payments
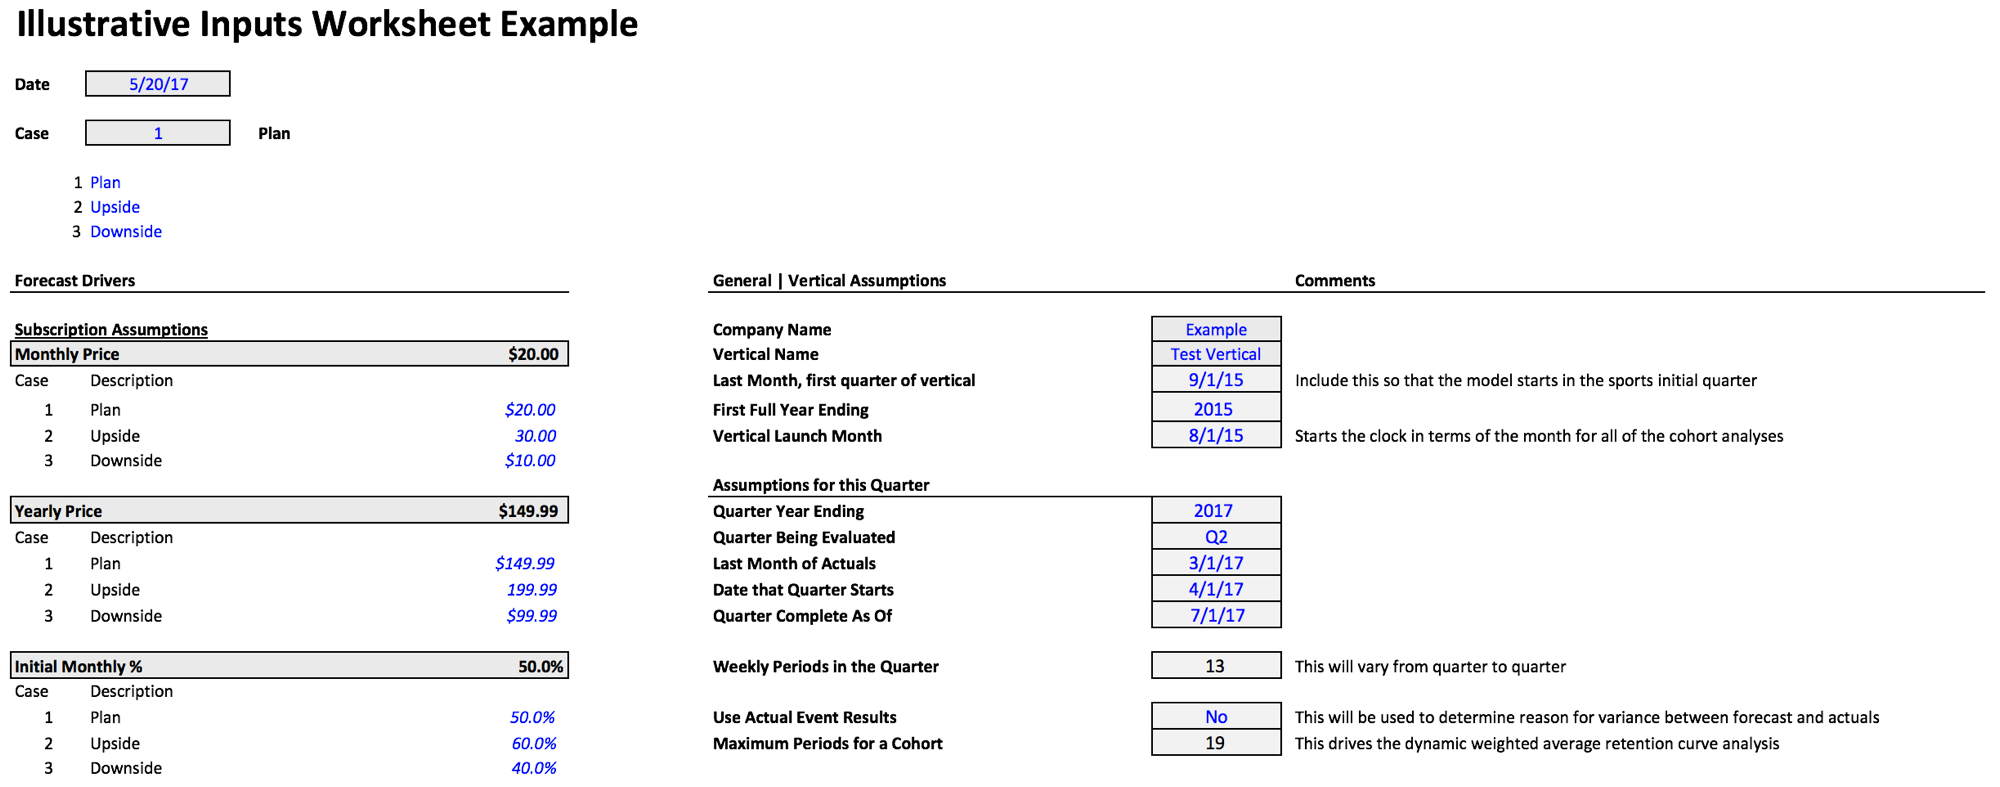
The model’s flexibility is generally accomplished by determining which input drivers are needed in order to drive dynamic formulas within; in this example, inputs such as vertical launch month, last month of actuals, and date quarter starts allow me to key the model off of the unique aspects of each sport while still generating one tailored to each sport’s history and without manual intervention / rewiring.
For those familiar with financial modeling, you know that you can make use of scenarios and cases to sensitize / stress test for various potential outcomes. One example could be, “what if we close a large sporting event deal in the 2nd month of the quarter”, but all of our key inputs, e.g., monthly price, remain the same. In this instance, to account for this possibility we would create a scenario, often using the offset function, that allows us to select whether or not we want the impact of this potential outcome to change certain inputs and then flow through the model. On top of this, we could combine the "Large New Event" scenario with a "Bull" case → “what if we close the large event and the % yearly mix for the quarter is 500 bps higher than we’ve seen historically, due to a more robust offering for the sport’s subscribers?”
Time to create a combined CSV for all forecasts. Finally, while each sport has an individual model, within each I added a worksheet that rolled up all of the key reporting metrics across the various worksheets as rows (weeks) and columns (metrics), which could then serve as a flat, query-able table → combining all of these model’s sheets into a single CSV is what enabled us to create a pacing dashboard. By doing so, we accomplished the following:
- Visual reports which reflect the quarter’s goals; easier for business users to understand what our goals are and how we are looking to achieve them
- A pacing dashboard to provide insight into how the sports are pacing versus forecast, including net cash / revenue, signups, subscribers and churn.
Part 3: Leveraging the right BI tools, aka Periscope Data FTW
I’ve written about Periscope's data cache before, and it proved to be extremely helpful in this case. Our data engineering team, which is very lean and always busy, is currently investigating Redshift Spectrum to make CSVs and other flat files “first class citizens”. In the meantime, we’ve used Periscope’s data cache in several ways. As one example, we’ve been able to accomplish cross database joins, one source's database in MySQL and the other in Postgres, while also combining data from a flat CSV file in order to generate 20+ charts for a time-sensitive dashboard; this dashboard satisfied one of our sports’ subscriber attribution reporting requests in probably 1/20th the time it might have taken to incorporate a proprietary ETL approach.
Periscope’s Cache has also been remarkably helpful in enabling us to quickly build proof of concepts for new data sources and receive feedback from business stakeholders; we accomplish this before ever requesting engineering to add new data sources into our ETL workflows. Furthermore, for the business users who are less familiar with requesting their current state data processes to become a part of our ETL process, Periscope's cache also provides us with a low-cost way to iterate on their reporting ideas prior to fully modeling the data and incorporating the new source(s) into our overall warehouse schemas.
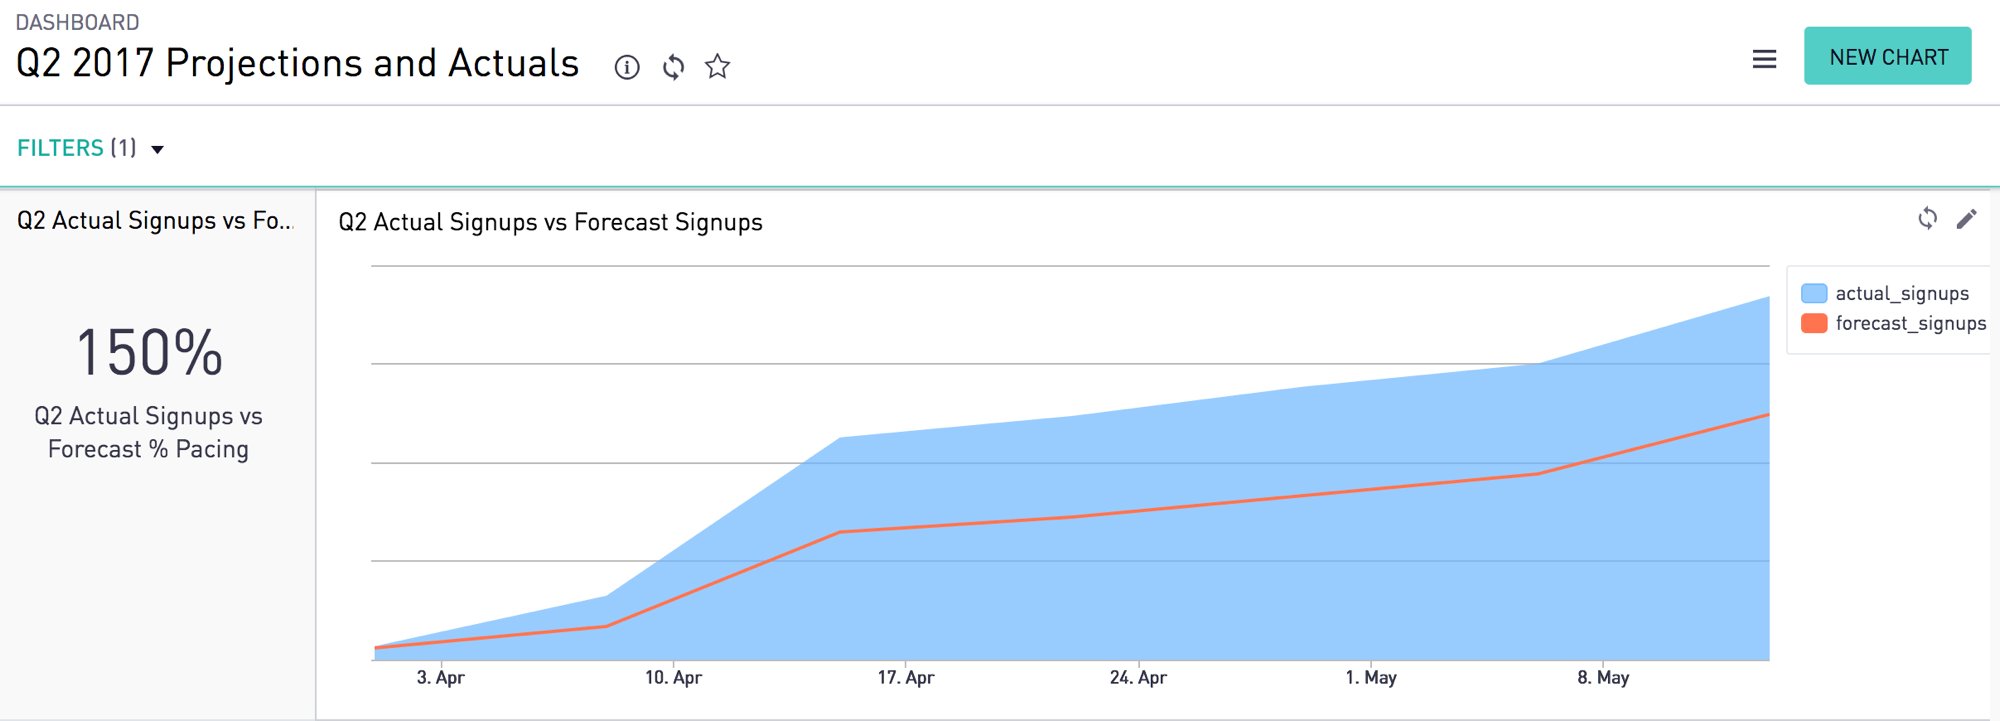
The Q2 Dashboard that we built using Periscope is a highly customizable reporting tool for business users which displays daily, weekly, monthly and quarterly pacing. This provides visibility for the rights acquisition team, marketers, management and the data analyst team in terms of where we are beating or potentially short on quarterly goals -- further, we can leverage the dashboard’s reports to trigger areas requiring additional investigations. Some examples include:
- An event exceeded its forecast by 1.5x
- Did we see better conversions through the live event funnel?
- What content seemed to work well in influencing visitors to convert to paid subscribers?
- Recurring cash from monthly subscribers is higher than forecast
- We saw higher retention than forecast; why would this be and how do we do more of this?
A sanitized illustration of the Q2 2017 dashboard
That’s effectively it -- it’s been rather rewarding that I’ve been able to combine my financial modeling background with data analytics, and it’s also gratifying that all of the hard work in defining and validating our business logic has made all of this possible. And thanks to Periscope Data for being such a great partner across our initiatives!
For those less familiar with a process such as this, I hope that this post is informative and sparks some ideas and new thinking, and I welcome any questions or additional thoughts in the comments below. While I recognize there are areas for improvement in terms of the work done here, I strongly believe that every company must adopt a Data Informed Rolling Forecast.